


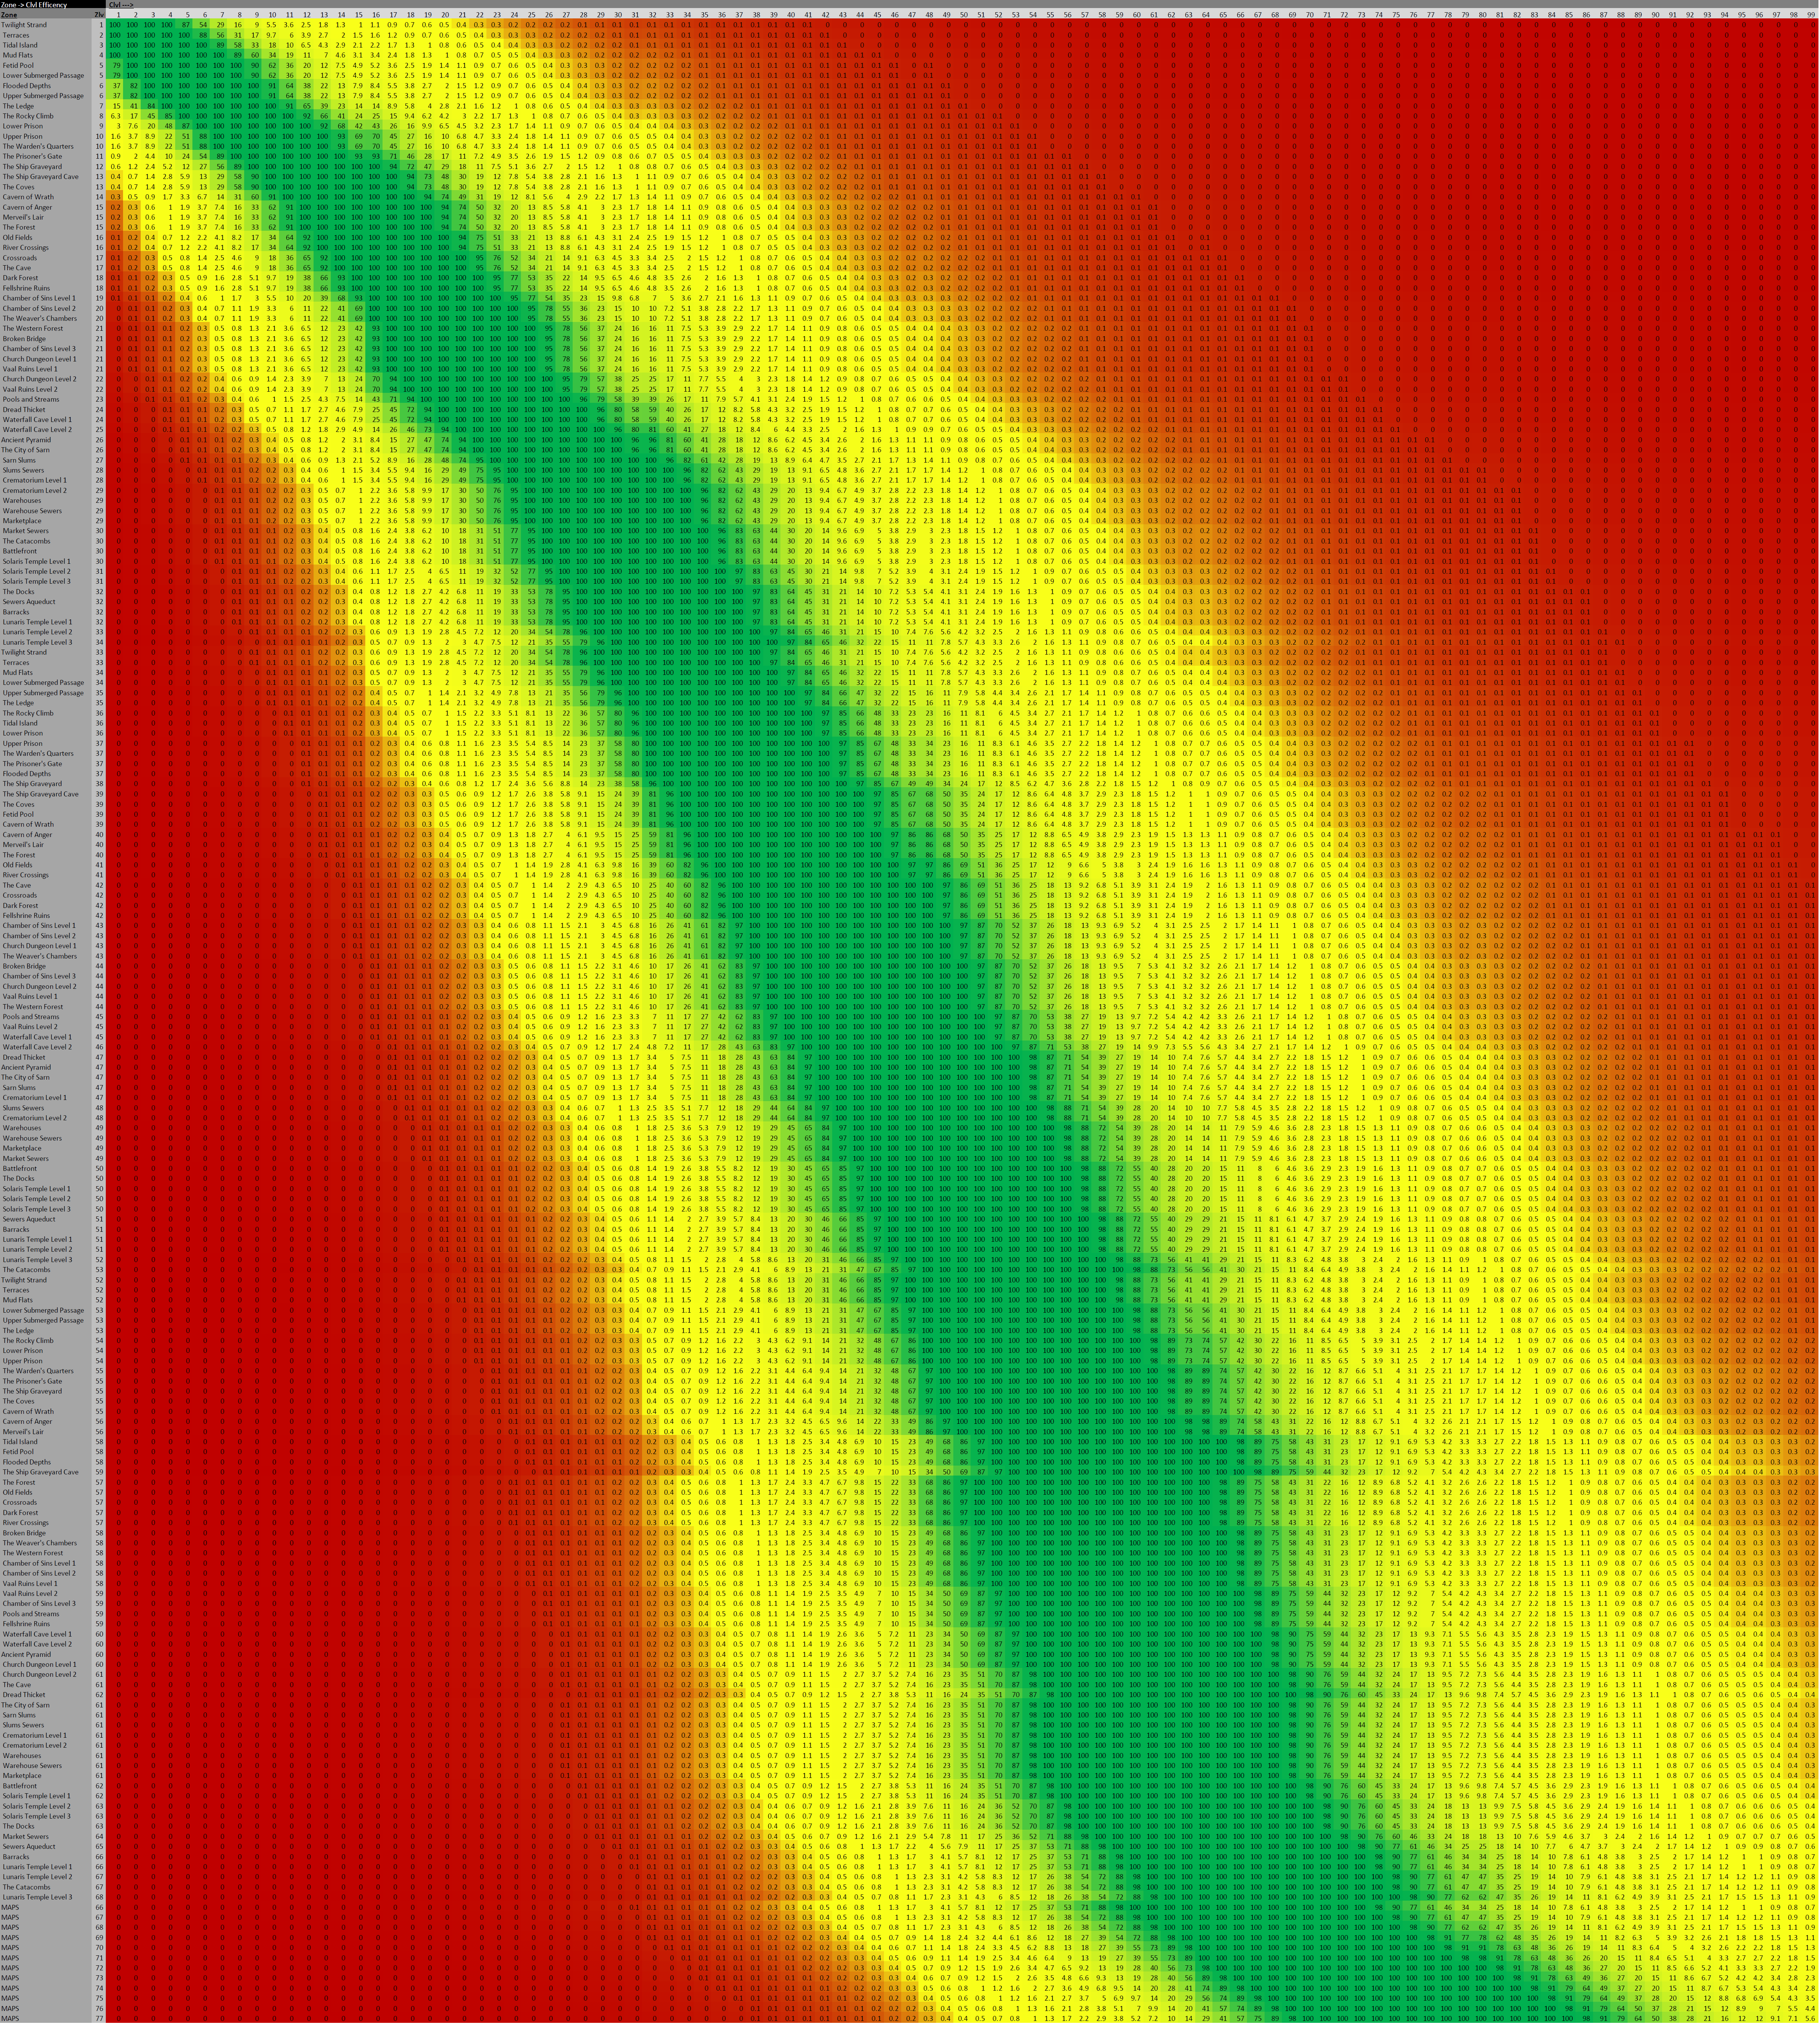
Experience Efficiency Chart: All Zones, All Levels, Color Coded
|
Update Nov 16,2013 - v2(1.0.0): Its been updated... mostly.. some of the zone levels are still not confirmed if they are the same or have changed that is noted with the '-NC' text after the zones name.
For those zones I either used the old level or I just guesstimated to make it fit where it should probably fall but they are likely wrong. The curve is a lot less smoother as I used the default order that normal creates for all of the difficulties this time. Again thanks for the words and any one is welcome to let me know when they think something is wrong/incorrect though I may end up asking for a length-ier explanation if I don't follow.. as is likely. This chart shows the efficiency of the experience gained from each zone accordingly to their level, side note white monsters in the zone use the zones level for theirs from my understanding. There is an old, Jan 7th, post that has a similar chart in it but it isn't color coded and only shows character level 60+ and zones 66+, idea probably being mapping relevant only. Nice thing about the doc is if a zone gets its level changed or new zones.. it can extend down as far as it needs and the zone level is only used once so that is an easy change. My doc has 3 main sheets + 1 little info sheet for more direct information about what is going on and what you are seeing for those who want it. I have all zones in all acts in all difficulties. The maps are tagged onto the end with just the Title Maps and the different levels they come in, being 66-78. Here's the link for the google doc v2(1.0.0): here I think that most of the points are correct and most of the weirdness can usually be attributed to the cells not being sized the same or some weird rounding issue is going on occasionally. I think I am done with the doc and if anyone wants to download it, save it, wants to change stuff around in a separate doc, make it an image, or w/e I don't care its free to use however you want to use it. EDIT: Okay I also decided to give everyone a picture of the chart just in case that's the way they want to use it: Outdated as of 1.0.0. Do take note the color code goes green is highest to red is lowest.. its the opposite!.. Excel to google doc and had to change it when I went to the google doc.. didn't change it to match in the picture as the pic was made and just needed to be uploaded at that point. The Photo is 4748x5281 and is a 6.050MB picture... this is just for if people don't want to deal with the doc or having to have to doc open to view it. So, I used pictureshack to upload the pic of it to as it was the only site that would take the image and not distort it. Last edited by Ebonmourn#7772 on Nov 17, 2013, 12:55:57 AM
|
|
|
I like the look of the image, nice work.
~ Please separate the PoE1 and PoE2 forums.
|
|
|
Except you forgot that the XP penalty effectively stops at clevel 68, the graph should all line up after zlevel 66.
IGN: Kulde
|
|
" No it doesn't, currency drop penalty stops at level 68. |
|
|
Nice chart, thanks!
IGN: KoTao
|
|
|
Holy shit. number!!!!!!!!!!!!!!! Having headache now. Perm. Retired from this unforgiving land of the Exiles.
Self-impost EXILED. |
|
|
Good work sir, I salute you.
IGN: Munkehboi
|
|
|
Great job! Very useful stuff :) I vote to add topic link to the sticky thread.
IGN: Avlee
|
|
|
Very nicely done, ty for nice formatting
|
|
|
Incredibly useful. Should be up there with all the other help threads!
IGN: Asser, AssDelver, Assphobic, AnointedAss, BetrayedByMyAss, CrackedAss, FracturedAss, FulcrumedUpMyAss, ImpaledAss, IncursionOfTheAss, WarForTheAss, UnleashTheAss, ScreamingAsshole, SwampAssKing, Yui
|
|


