POE 2 Complete PC Freeze while loading screen
|
Even after the new patch. still hard crashing. this sucks.
|
|
|
Reminder to use the "--ex-crash-report" to send crash report data to GGG whenever you crash.
(freeze or crash, both works) For Steam: Goto Library->Path of Exile 2 properties by right-clicking the icon->General->Launch Option-> Add --ex-crash-report to the box. 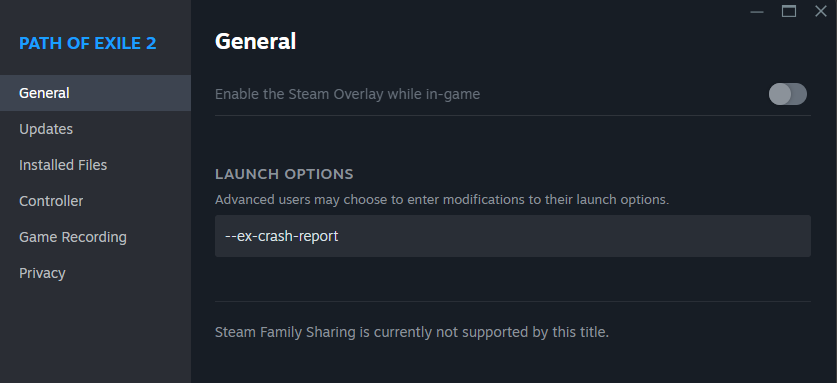 For Standalone client: Right the desktop shortcut->Properties->In the target field add --ex-crash-report 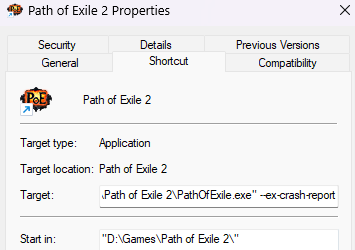 Last edited by Climet#7103 on Feb 18, 2025, 6:37:18 AM
|
|
" Something tells me the two of you would have solved this issue in 1 day if you where given permissions to the actual code. Would be so sad but hilarious if the actual issue is because someone commented out code somewhere in the engine that no-one dares to touch anymore. Or if it were their own doing even: like "This piece of code don't seem to do anything .. load-times will likely be a bit faster if we just remove it" We will likely never know, but lets hope that the info might help them solve the issue. Im actually rooting for them. I believe no fans of the genre actually wants to see GGG fail. This old crappy engine they are using is really staring to become a huge problem though. Last edited by snurrfint#5780 on Feb 18, 2025, 9:03:25 AM
|
|
|
Because I have some time I tried to investigate the hang some more. But then I saw that there was an update and I tried to generate the hang "burning" some low tier maps. Entering the map and then go back to hideout and after like 10+ maps I had 0 crashes :). Idk what happened and idk if my last analysis helped GGG but at first glance it seems to be fixed
// LE: Nvm. Just got a crash Last edited by IceCool10#6669 on Feb 18, 2025, 1:21:56 PM
|
|
|
can't play since I "upgraded" to windows 11...
online up to 5-10mins. hard crash, freeze... this is rubbish! fix it please. DxDiag has been sent. |
|
|
I gave up and uninstalled the game.
Good luck. |
|
|
Just uninstall the game at this point and move on with your life, it will not change any time soon or for the better. This trend has persisted for a while by GGG.
Call them out on every single social media platform, don't let them get away with this. Like so may others I paid to play this game and I can not even do that. There will be a fix in a few years... maybe... sigh Someone should start a class action lawsuit to refund the early access purchase price. They delivered not even half of what they promised in EA and the game is actually unplayable. Last edited by Braric#4417 on Feb 18, 2025, 6:28:06 PM
|
|
|
After some hours I've managed to trigger another crash again. And I kinda saw something. I can't say that I have some good info but who knows, maybe it helps. Also, my debugger bugged and it prints the same thing twice ( sorry about that ) but I didn't have that much time to make the output look nice and I didn't want to try to restart the debugger and try to generate another crash.
So I was printing the stack trace from all threads when the exception occurs: " That is just a snippet but the thing is : Thread 15 has the same lpStartAddress as the others ( bold text ) and yes, that is a return address not the start address of the thread but based on the assembly code the start address is the same. But for some reason thread 15 generates an exception. " And this is the code that creates those threads: " And those other threads that don't generate an exception are waiting and here is the code: " And this code is called from here ( from sub_140C55D10 ): " Then I searched for a call to this function (sub_140C55D10) to try to understand what might cause the exception but there are no calls. At least not in the main executable. All I could found was an array that contains this function: " Then I've searched for that array in the code: " Ok, so this looks like a function that prepares an EXCEPTION_RECORD struct or something like that. Now this code seems to be called only if cmp rbx, rsi is NOT true ( RBX != RSI ) and RBX and RSI are two QWORDs that are sequentially in memory RBX = *RSI and then RSI = *(RSI+8). Now I was trying to understand what are those and when RBX != RSI but unfortunately I don't have too much time now. All I've seen was a .text:0000000140C53EFC 48 8D B7 F8 00 00 00 lea rsi, [rdi+0F8h] and .text:0000000140C53CF8 49 8B F0 mov rsi, r8 So RSI comes initially from RDI+0xF8 or from the third parameter ?? ( although it's a variadic function ) ( probably first case -> RDI+0xF8 ). And while I am writing this, Im pretty sure it's from [rdi+0xf8]. Seeing that 0xf8 I was like "WAIT A MINUTE!". I know that value. It's the offset of RIP from the _CONTEXT structure :). " And every thread has such a structure. So I am pretty sure rdi holds the _CONTEXT structure. Idk how much this helps ( I hope it does ) but I guess at least I can come back to it when I have some more time. |
|
|
I used to crashed to my desktop every 5m. After I lower my pcore to 46 I haven't crashed since. Thank you!
|
|
" Before we start: Please run 0:015> r. My observations: Thread 15 (502c): Raising an Exception but more importantly it is not waiting, instead it is actively crashing. If this thread was supposed to signal one of the waiting threads, the wake-up signal is lost, causing the other threads to remain stuck. In our case it is. Threads 16, 17, 18, 19: These are stuck in SleepConditionVariableSRW(). Since Thread 15 crashed it will never come and they will remain stuck forever. Them sharing the same address means thread 15 was performing a critical task but failed, leaving the others in limbo. The next block is an exception handling method as evidenced by the existence of CxxFrameHandler4. After returning from sub_1401CAF60, the function: 1) Executes a nop (likely for alignment or debugging). 2) Clears the eax register (xor eax, eax), meaning it is returning 0. Returning 0 indicates success if they are following the standard coding practices. 3) Restores the stack (add rsp, 58h). 4)Returns (retn). Return is 0. Since sub_140C560B0 only calls sub_1401CAF60 and returns, it is unlikely that sub_140C560B0 itself caused the exception. Instead, sub_1401CAF60 is the function that either crashed or explicitly threw an exception. If sub_1401CAF60 performed an invalid operation (for example dereferencing a null pointer, accessing an invalid memory location, or causing a divide-by-zero error), it could trigger an access violation (0xC0000005). If sub_1401CAF60 encountered an assertion failure or logic error, it could have explicitly called RaiseException(), causing Thread 15 to crash. If sub_1401CAF60 was supposed to signal a condition variable before returning, but instead crashed, then: Thread 15 stopped before waking up waiting threads (Threads 16-19). This left those threads stuck in SleepConditionVariableSRW(). The result: a deadlock, leading to a system freeze. Continuing on for the block "this is the code that creates those threads": The thread stack size is being set (dwStackSize = 0x80000 or 512KB). This means the thread is given a dedicated stack size, but not an unusually large one. Now this in itself can give us actual details about what sub_1401CAF60 which is called by sub_140C560B0 supposed to do because Explicit Stack Size is often used only on certain things and we know from your previous post that there is a recurring pattern of function calls for DX12 so this is most likely: Shader compilation. Other possibilities are: Command buffer generation, scene rendering traversal. For a Vulkan/DX12 worker thread handling deep recursion, large GPU structures, or multi-threaded rendering 512KB is quite low. Now... I both want this to be true and false at the same time but... 0x80000 is 512KB 0x800000 is 8MB. 8MB is also the suggested stack size for heavy workloads such as... Deep recursion. It is also small enough to be missed. If this is not it then 512KB is just a red herring. But still it is quite low in my opinion since even the default is 1MB. A well optimized code could be able to run this in a way that Toyota Hilux was running at the end of Top Gear. Why I'm focused on this: If the thread overflows its stack and corrupts kernel memory, it can cause a system-wide freeze instead of just crashing the application. Some Windows drivers use the same kernel stack memory region, meaning an out-of-bounds write could cause a hard lockup. Anyway... Continuing on from "those other threads that don't generate an exception are waiting and here is the code": This is a System API. And it points out to the following scenario: 1) If Thread 15 is on deep recursion and exhausted its 512 KB stack, it would crash before completing execution. 2) It would crash before calling WakeConditionVariable() 3) Without WakeConditionVariable() no threads are ever woken up, leaving the others stuck. 4) If these threads were rendering threads, the entire graphics pipeline would stall, leading to a system freeze. Continuing from "this code is called from here ( from sub_140C55D10 )": This function appears to be preparing and waiting on a condition variable, ensuring that a certain event or resource becomes available before proceeding. The key is that it eventually calls sub_1422D69F4, which in turn calls SleepConditionVariableSRW(). This means that if the expected condition is never met, the thread will wait indefinitely. rdi is the first function parameter, meaning this function is likely operating on an object (for example a synchronization object, a queue, or a resource handler). Continuing from "The Array": I believe this is a thread pool managing GPU work. A GPU task scheduler could assign worker threads to functions in this list. A failure (such as stack overflow in Thread 15) could disrupt the entire system, leaving worker threads waiting. Continuing from "Then I've searched for that array in the code": I'm now 99% sure this is the thread pool managing GPU work. The function iterates through a list of work items or jobs (rsi linked structure). It loads a function pointer table (off_1427D3C30), meaning it dynamically selects which function to execute. There’s exception handling (pExceptionObject), but if a failure is not properly handled, it could leave threads stuck. We know it is not properly handling. The final box: YOU MIGHT HAVE SOLVED IT. OR COME VERY CLOSE TO IT. Please run 0:015> r. It would print all register values, including Rip, Rsp, and Rbp, which could confirm if: If Rip is in RaiseException(), the crash was likely triggered deliberately (assertion failure, runtime abort, etc.). If Rip is an invalid address, the stack may have overflown, corrupting return addresses. If Rip points to a function in PathOfExileSteam, the game’s threading code is failing internally. If Rsp is abnormally low, it strengthens the case that 512 KB was too small, leading to a stack overflow. TLDR: There might be a typo at the point where they set the stack sizes. 0x80000 is 512KB 0x800000 is 8MB. The size is set as 0x80000. Obligatory: If only GGG were honest we would not even have to have this conversation... We could simply look at GGGs explanation of the situation with proper technical information but we can never know why exactly this is happening as GGG keeps being dodgy and dishonest. By the way, Microsoft is still not acknowledging this is a Windows 11 24H2 issue as claimed by GGG. As long as GGG is not interested in open and honest communication our only other option is to increase the pressure and warn others by giving a negative review for Path of Exile 2 on Steam in a detailed and informative manner. I cannot send/reply to direct messages because my in-game character has not finished Act 1. What to do: 1)Write a short review about the hard crashes in notepad. 2)Copy and paste it to steam reviews, put up a negative review. 3)Copy and paste it to steam discussions, put it up there. Last edited by Cainrith#2807 on Feb 18, 2025, 8:22:47 PM
|
|